|
Table of Contents : |
| 1. | Login to your account using the username and password provided. | |
| 2. | Hover over the Reports tab and Click on the Third Party Audit Trail tab. |  |
| 3. | Navigate to right hand side of the page and Select Usage Chart option from the list. |  |
| 4. | Click on the VIEW CHART button. It will open a new window. |  |
| 5. | Select Client from the list. |  |
| 6. | Select Company from the list. |  |
| 7. | Select Users from the list. | 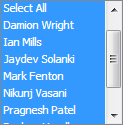 |
| 8. | Tick the checkbox on Single Date or Multiple Date and select other relevant details. Note: you can select only one tick box at a time. |
 |
| 9. | Select Bar Chart from the list. |  |
| 10. | Click on the VIEW button. |  |
| 11. | It will show you Bar Chart at the bottom of the window. | 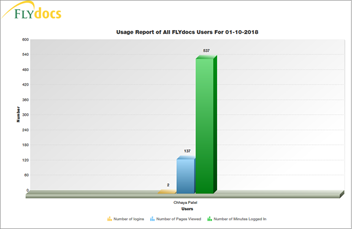 |
| 1. | Login to your account using the username and password provided. | |
| 2. | Hover over the Reports tab and Click on the Third Party Audit Trail tab. | |
| 3. | Navigate to right hand side of the page and Select Usage Chart option from the list. | |
| 4. | Click on the VIEW CHART button. It will open a new window. | |
| 5. | Select Client from the list. | |
| 6. | Select Company from the list. | |
| 7. | Select Users from the list. | |
| 8. | Tick the checkbox on Single Date or Multiple Date and select other relevant details. Note: you can select only one tick box at a time. |
|
| 9. | Select Line Chart from the list. |  |
| 10. | Click on the VIEW button. | |
| 11. | It will show you Line Chart at the bottom of the window. | 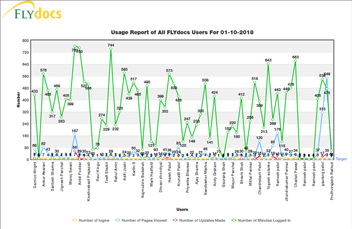 |
How do I view Stacked 2D Chart?
| 1. | Login to your account using the username and password provided. | |
| 2. | Hover over the Reports tab and Click on the Third Party Audit Trail tab. | |
| 3. | Navigate to right hand side of the page and Select Usage Chart option from the list. | |
| 4. | Click on the VIEW CHART button. It will open a new window. | |
| 5. | Select Client from the list. | |
| 6. | Select Company from the list. | |
| 7. | Select Users from the list. | |
| 8. | Tick the checkbox on Single Date or Multiple Date and select other relevant details. Note: you can select only one tick box at a time. |
|
| 9. | Select Stacked 2D Chart from the list. |  |
| 10. | Click on the VIEW button. | |
| 11. | It will show you Stacked 2D Chart at the bottom of the window. | 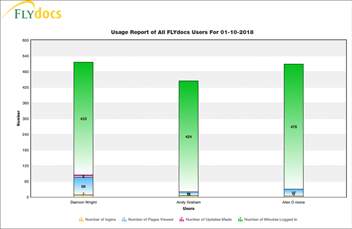 |
How do I view Stacked 3D Chart?
| 1. | Login to your account using the username and password provided. | |
| 2. | Hover over the Reports tab and Click on the Third Party Audit Trail tab. | |
| 3. | Navigate to right hand side of the page and Select Usage Chart option from the list. | |
| 4. | Click on the VIEW CHART button. It will open a new window. | |
| 5. | Select Client from the list. | |
| 6. | Select Company from the list. | |
| 7. | Select Users from the list. | |
| 8. | Tick the checkbox on Single Date or Multiple Date and select other relevant details. Note: you can select only one tick box at a time. |
|
| 9. | Select Stacked 3D Chart from the list. |  |
| 10. | Click on the VIEW button. | |
| 11. | It will show you Stacked 3D Chart at the bottom of the window. | 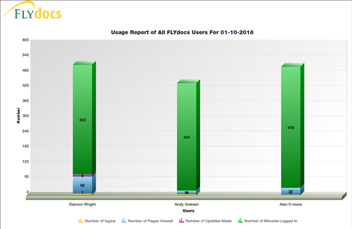 |
How do I view Stacked Bar 2D Chart?
| 1. | Login to your account using the username and password provided. | |
| 2. | Hover over the Reports tab and Click on the Third Party Audit Trail tab. | |
| 3. | Navigate to right hand side of the page and Select Usage Chart option from the list. | |
| 4. | Click on the VIEW CHART button. It will open a new window. | |
| 5. | Select Client from the list. | |
| 6. | Select Company from the list. | |
| 7. | Select Users from the list. | |
| 8. | Tick the checkbox on Single Date or Multiple Date and select other relevant details. Note: you can select only one tick box at a time. |
|
| 9. | Select Stacked Bar 2D Chart from the list. | 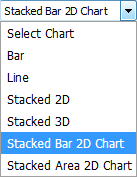 |
| 10. | Click on the VIEW button. | |
| 11. | It will show you Stacked Bar 2D Chart at the bottom of the window. |  |
How do I view Stacked Area 2D Chart?
| 1. | Login to your account using the username and password provided. | |
| 2. | Hover over the Reports tab and Click on the Third Party Audit Trail tab. | |
| 3. | Navigate to right hand side of the page and Select Usage Chart option from the list. | |
| 4. | Click on the VIEW CHART button. It will open a new window. | |
| 5. | Select Client from the list. | |
| 6. | Select Company from the list. | |
| 7. | Select Users from the list. | |
| 8. | Tick the checkbox on Single Date or Multiple Date and select other relevant details. Note: you can select only one tick box at a time. |
|
| 9. | Select Stacked Area 2D Chart from the list. | 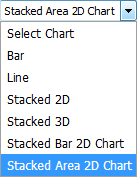 |
| 10. | Click on the VIEW button. | |
| 11. | It will show you Stacked Area 2D Chart at the bottom of the window. | 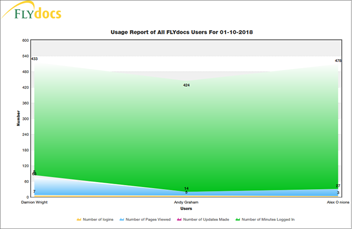 |
|
Note:- If you do not see this option appear it is due to access restrictions for your user account. please contact an administrator. |
Lauren Partridge
Comments